



Skip to content

Risk assessment for emergency management

Your plans already hold the evidence.We add the national record.

Hazzard reads your hazard plans, THIRAs and studies and sorts what they say into 73 hazards and threats. It adds FEMA, NOAA and Census data and drafts a cited assessment your team scores.

One risk assessment for every hazard you face

13 categories · 73 hazards and threats · Browse the taxonomy

The product

Five places your team lives

Emergency managers do the work here, and leadership can follow along. Each chapter opens on real screens. Examples use Cedar Ridge, a made-up town.

How it works

You already have the evidence. It’s stuck in PDFs.

Your plans, THIRAs and studies already describe what you face. Hazzard reads them page by page and checks each quote against its source. Then it joins them to data from 8 federal agencies for your county.

01What you already have

  • Hazard mitigation plan

  • THIRA / SPR

  • Emergency operations plan

  • Wildfire protection plan

  • Asset inventory

  • Consultant study

02Hazzard reads every page

  1. Read every pageText, scans, tables and figures
  2. Extract hazard mentionsQuoted verbatim from your documents
  3. Verify against the sourceEvery quote checked to its page
  • Federal Emergency Management Agency logoFEMA4 datasets
    1. Plan Status Registry
    2. National Risk Index
    3. HMA Projects
    4. Disaster Declarations
  • National Oceanic and Atmospheric Administration logoNOAA2 datasets
    1. NOAA County Weather
    2. NWS Active Alerts
  • U.S. Census Bureau logoCensus Bureau1 dataset
    1. Census ACS Profile
  • U.S. Department of Health & Human Services logoHHS1 dataset
    1. HHS emPOWER
Live · Daily, 07:00 UTCLogos identify each dataset’s publisher; no endorsement is implied.

03One cited record

Mitigation plan, 2021

Example
  • 4.2 Hazard profile: Wildfire

    “The wildland–urban interface on the county’s western edge has grown with each plan cycle.”
    p. 142Quote matches pageSubstantive
  • 5.1 Capability assessment

  • 6.3 Mitigation actions

04Your team rates every hazard

73 hazards and threats, 13 categories

ExampleLikelihoodImpactReadinessWildland fireRiverine floodingTornadoRansomware

Drafted from cited evidence. Rated by your team.

See how these datasets apply to your jurisdiction

We pull the national record for your county and show what your existing plans add to it.

Every plan you write starts with the same risk assessment

Mitigation, operations, incident and capability plans all ask what could happen, how bad it would be and how ready you are. Most teams answer that again for every plan. Hazzard keeps one answer current, and every plan starts from it.

  • Hazard mitigation plan

    Reduce long-term community risk

    Every 5 years

  • Emergency operations plan

    Roles, coordination and declarations

    Every 3 years

  • Incident-specific plans

    Flood, wildfire, active threat, cyber, hazmat

    As threats change

  • Capability assessments

    Staffing, equipment and resources

    Every budget cycle

Done by hand, the assessment is:

  • Scattered across many reports
  • Inconsistent methods
  • Out of date by the next cycle
  • Hard to defend to officials
The output

A brief that defends itself

One hazard, scored 1 to 5 for likelihood, impact and readiness on your own scale. Every figure is sourced. Every sentence is tied to its page.

  1. 1

    Scored by your team, on your scale

    Likelihood, impact and readiness, each with its level definition. Hazzard drafts the reasoning. Your team sets the score.

  2. 2

    Your plans alongside the federal record

    Your documents and their verified quotes, next to FEMA declarations and the National Risk Index.

  3. 3

    Cited to the page

    Each footnote opens the quote and page it came from, on screen and in print.

Where this brief sitsBrowse the taxonomy →
  1. 73 hazards & threats · 13 categories

  2. Wildfire · 3 items

    • Wildland Fire
    • Wildland-Urban Interface Fire
    • Grassland / Prairie Fire
  3. Evidence brief

    Wildland Fire

    Cedar Ridge County (example)

    L3 · I4 · R3

Evidence brief for Cedar Ridge County (example)

September 14, 2026

Wildland Fire

Hazard in Wildfire, on the established threats & hazards list

Impact
5432112345

Likelihood

Likelihood
3

Possible — Expected occasionally — roughly once in 10 to 50 years (2–10% chance in any year).

Impact
4

Major — Severe effects — casualties possible, serious damage across a significant share of the jurisdiction, essential services disrupted for weeks, outside assistance needed.

Readiness
3

Moderate — The organization has a generally established capability to manage this threat or hazard, but identifiable gaps remain. The organization could likely perform many required actions, though effectiveness may vary depending on conditions, staffing, resources, or complexity.

  • 3source documents
  • 148verified mentions
  • 2federal declarations
  • 91.6NRI score, relatively high
Likelihood

3 of 5, Possible · verified

The county fire district recorded 64 wildland fires from 2010 through 2024, most under one acre; the largest, the 2018 Pine Hollow Fire, burned 1,240 acres.1 The 2022 wildfire protection plan maps 18,400 acres of wildland–urban interface along the western foothills, with about 3,100 homes within half a mile of continuous fuels.2

Sources for this assessment

  1. 1“Between 2010 and 2024 the District responded to 64 wildland fires, the majority of which burned less than one …”C, p. 4
  2. 2“The WUI boundary encompasses approximately 18,400 acres, concentrated in the western foothills, with roughly 3…”B, p. 12
Worked example: Cedar Ridge County is fictional. The scores illustrate the format and are nobody's decision.
  • Faster

    Start planning work sooner.

  • Consistent

    One method across all your plans.

  • Defensible

    Each conclusion traces to a source and a person.

  • Current

    New documents update the record.

Each plan cycle builds on the last one instead of starting over. See pricing →

The national record

What does Hazzard already know about your county?

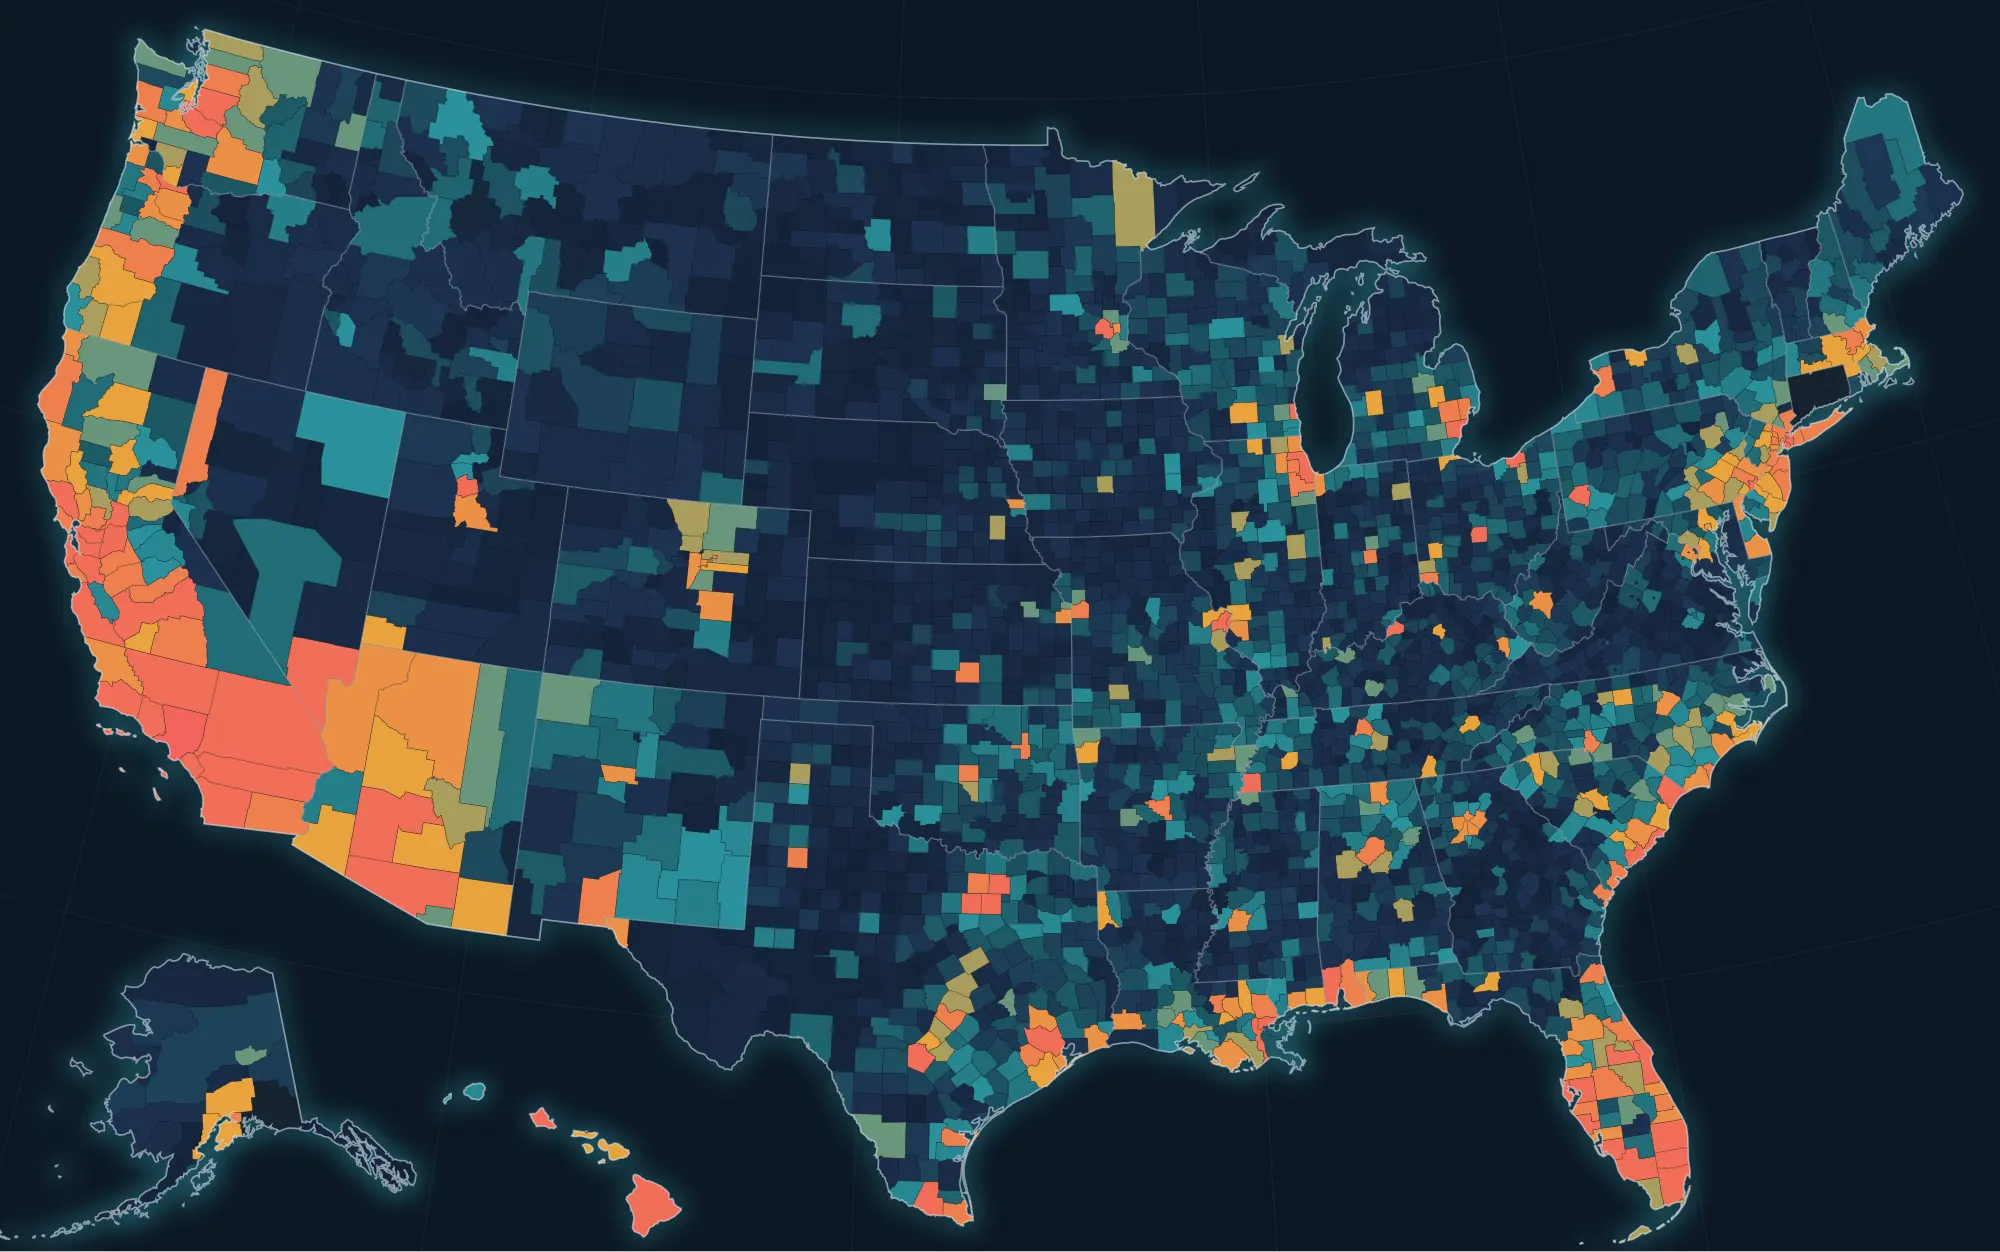
FEMA’s National Risk Index, disaster declarations, plan status, Census and NOAA data for every U.S. county. 8 public feeds sync daily, so it is loaded before your first meeting.

hazzard.ai/explore
Map of the United States with each of 3,133 counties coloured by its FEMA National Risk Index percentile.
3,133 countiesLowerHigher

Every county’s composite risk, FEMA National Risk Index. Find your county →

Who builds this

An emergency manager and an AI engineer.

Patrick has written and run the plans Hazzard reads. Chris has shipped AI systems that had to pass an audit. We built Hazzard because a community’s risk picture is scattered across binders, consultants and inboxes.

  • Emergency management leader who has planned for and responded to disasters nationwide
Patrick Van Horne, Co-founder & CEO

Patrick Van Horne

Co-founder & CEO

Boulder, Colorado

Patrick leads Hazzard's strategy, operations, customer development, and go-to-market efforts. His career has focused on helping organizations understand risk, prepare for uncertainty, and make better decisions before consequences become unavoidable.

Christopher Knight, Co-founder & CTO

Christopher Knight

Co-founder & CTO

Denver, Colorado

Chris leads Hazzard's product, engineering, and technical architecture. He builds software and AI that help people work from the same body of information, with the source and the review still attached.

Built for government security review

  • Control frameworkin place
  • GovRAMP membershipin progress
  • GovRAMP verificationplanned
Hazzard Insights

Notes from the field.

Short articles for emergency managers and planners on hazard plans, county risk data and using AI with citations intact.

  • Hazard mitigation plans
  • County risk data
  • AI for emergency management
  • Lessons from the field
Book a walkthrough

Bring your documents. Leave with a cited brief.

Send us your public documents before the call and we’ll set up your workspace. You keep the brief whether or not you work with us.

  1. Tell us about your project

  2. We prepare from public data before we meet

  3. You leave with a cited brief for one hazard

Already have an account? Sign in

Request a walkthrough

Takes about two minutes. A person reads each request.

Or start by marking your area on the map